Reporting for Distribution Companies on Acumatica, Business Central, and Sage Intacct

The quarterly review is Monday and someone wants margin by product line for the last six quarters, broken out by sales rep, with a note on why the fastener line slipped. The ERP shows today’s inventory and a turnover ratio on a dashboard. It does not hand you that analysis. Reporting for distribution companies almost always splits this way: the system holds the transactions, and the formatted, multi-period view that a team actually reads gets assembled somewhere else. Whichever ERP runs the warehouse, that somewhere else is Excel, because the comparison, the ranking, and the commentary are work the system has no place to put.
What reporting for distribution companies has to answer
Distributors run a recurring set of questions. Inventory turns by item and by category. Margin by product line and by customer. Sales by rep and by region against last year. Fill rate and on-time shipping. Slow movers and dead stock heading for a write-down. Vendor spend by terms. Every one of these crosses inventory, sales, purchasing, and the general ledger, and the raw numbers exist as transactions the moment they post. The gap is between monitoring and analysis. A dashboard tells you the turnover ratio right now. The review needs this quarter’s turns set beside the last five, with the obsolete items flagged and a sentence explaining the trend. That second thing is the job, and it repeats every period.
Acumatica: built for distribution, exported flat
Acumatica’s Distribution Edition is built around the distribution workflow. Its Inventory, Sales Order, and Purchase Order modules feed native reports like Inventory Valuation, Inventory Turnover, and ABC Analysis, plus dashboards carrying the KPIs distributors watch: turnover ratio, on-time shipping, profitability by item. Generic Inquiries reach any field in the system, including custom ones, and publish it to a dashboard or export it. For live monitoring on screen, this holds up well.
The boundary appears when the analysis has to be formatted and span periods. The Analytical Report Manager, Acumatica’s financial report writer, reads amounts posted to GL accounts, so the operational cuts a distributor needs sit outside it. Export a Generic Inquiry to Excel and you get a Data sheet and a Parameters sheet of values frozen at the moment you ran it. The layout work moves to Excel anyway, and the numbers behind it are dead on arrival.
Business Central: the data is there, the views aren’t
Business Central keeps the detail in the item ledger and exposes it through analysis views and analysis reports, with analysis by dimensions for cuts like location, item category, or sales territory. Item statistics summarize sales and purchases per item. The constraint is upkeep and reach. An analysis view has to be configured and then updated to pull recent subledger entries, so a report is only as current as the last time someone refreshed the view behind it. Pulling a clean dataset that spans inventory, sales, and the GL is difficult without a developer or a data warehouse, and anything living in a third-party extension adds another consolidation step. Some formatting drops on the way out to Excel.
Sage Intacct: strong on finance, lighter on the warehouse
Sage Intacct is a finance-first cloud ERP, and that shows in distribution reporting. Its Inventory Management module ships templates for inventory valuation, stock movement, purchase order analysis, and sales order fulfillment, with dashboards and a custom report writer business users can drive without IT. Sage positions deeper distribution and manufacturing capability in a separate product, Sage Distribution and Manufacturing Operations, so a distributor with heavier warehouse complexity reaches for that layer. The report writer that makes Intacct strong on the P&L is built around the general ledger, so warehouse-level analysis like turns by SKU sits outside its core. Exports carry values rather than live formulas.
Why the analysis ends up in Excel
The three take different paths to the report, and they land in the same place. The periodic distribution report gets built in Excel because Excel is the one surface that holds operational data, financial data, multi-period comparison, and commentary in a layout the analyst controls. Margin by product line next to budget, sales by rep ranked with last year alongside, a slow-mover list with a write-down column: straightforward in a spreadsheet, awkward inside a row-and-column ERP report. Freshness is what fails. Every export goes stale as soon as the next order posts, so each cycle restarts with a new pull and another round of re-pasting, and the standing question of which figures nobody updated.
Reporting for distribution companies that stays live
Velixo connects Excel directly to Acumatica, Business Central, and Sage Intacct through each system’s API, under the user’s own ERP sign-in and security. Operational data arrives in live cells alongside the financial figures. On Acumatica, Velixo reads General Ledger, project data, and Generic Inquiries through a toolbar of more than sixty functions, so the sales, inventory, and vendor data behind a distribution report flows into the workbook live and refreshes in place. On Business Central and Sage Intacct, the same connection feeds the item and transaction detail the analysis runs on. Right-click a margin figure and drill to the orders that produced it. Multi-entity and multi-instance consolidation runs through single functions, so a group with several warehouses or companies pulls into one workbook without an export per location. The turnover report or margin pack you already built keeps its layout and its formulas, and a refresh makes it current instead of starting it over. When a number has to go back to the ERP, Velixo writes it back from the same sheet.
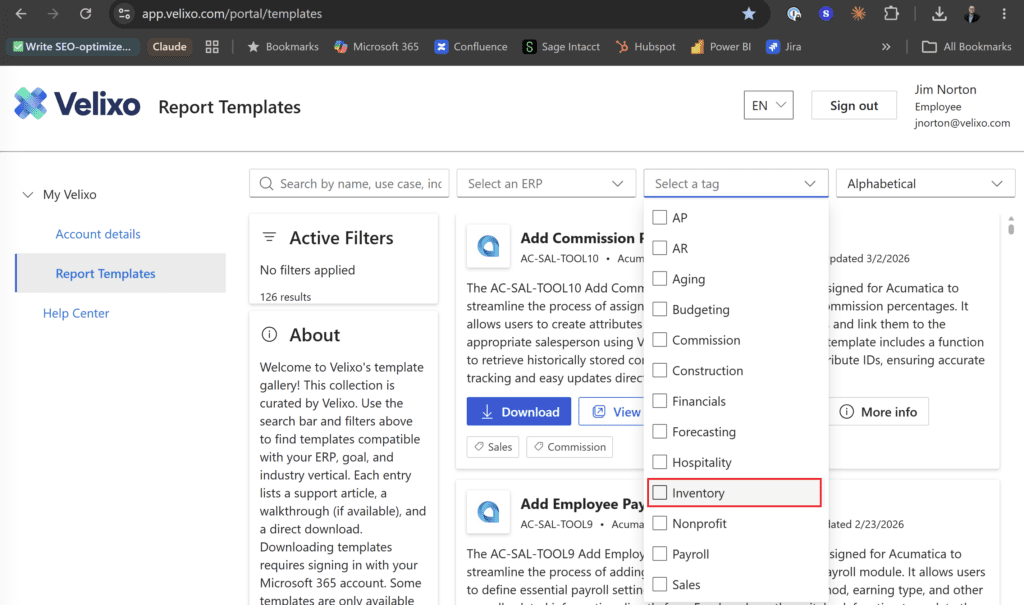
Velixo’s prebuilt templates library features a selection for inventory-related reporting.
Reporting for distribution companies across all three ERPs
The proof customers report is about the refresh, and a distribution report refreshes often. Tom Flanagan, controller at Yardnique on Sage Intacct, says the ERP was the better system but lacked the export of formulas to Excel, and that Velixo saves him two to three hours every time he hits refresh. Rebuild a margin or turns report weekly and that time compounds fast. Operational reporting on inventory, sales, and KPIs drawn from any ERP data object is a core Velixo use case, and it runs the same way on Acumatica and Business Central, because the analysis sits above the ERP, in the workbook where the distribution team assembles it.
Velixo connects Excel to Acumatica, Business Central, and Sage Intacct, pulls live inventory, sales, and GL data into the report you already use, refreshes it in place, and writes numbers back, all under your ERP sign-in and security. See how Velixo works with your ERP.